
Product launches are arguably the biggest and most important part of your Go-to-Market strategy.
They’re the result of months (or years) of work, and there’s nothing quite like finally going live with your launch event. But a product launch isn’t just a big announcement; it’s also a strategic step in your overall GTM plan.
How do you measure your launch success? When your product goes live, there’s a lot to keep track of to ensure its success. Metrics and KPIs give you the power to control, track, measure, and adjust your product launch, especially if it's not delivering the results you need.
In this article, we’ll discuss the metrics for product launch success and how to measure them.
Let’s get into it. 👇
Product-market fit
In simple terms, product-market fit means that there’s a demand for your product.
We all hope to achieve it, but it's easier said than done. You can look for signs you’ve achieved product-market fit, like high and sustainable sales, positive customer feedback, and minimal churn.
But why measure something so vague?
Although it is hard to define and more of a state of being than a hard KPI, product-market fit means you’re resonating with the market. That’s hard to do and harder to sustain, so you need to be able to track how successfully you’re doing this if you want to keep it up.
Net Promoter Score (NPS)
However, while product-market fit is difficult to measure, your NPS, or Net Promoter Score, is easier.
Why is this worth looking at? It can give you a sense of how you’re doing. Given that your product-market fit is a good indicator of whether or not your customers want your product, understanding how your buyers feel can point you in the right direction when restrategizing.
To calculate your NPS, conduct quantitative research among your customers and ask how many are likely to recommend your brand or service.
The formula looks a little like this:
[% of promoters] - [% of detractors] = NPS score.
Based on your results, think of how to improve or sustain your business strategy to better reach your ideal customers or boost trust and loyalty.
Remember, where you're unable to establish your product-market fit, your NPS is a pretty strong indicator of whether or not your product or service is meeting your customers’ unique demands.
Win/loss analysis
A win/loss analysis, or the success ratio, tells you a bit about how many winning sales you've got. Along with calculating your win/loss ratio, look at your win rate.
It sounds straightforward, but you do need to define a win before tracking to ensure consistency.
Typically, a win is when a prospect chooses you over a competitor, a loss is when they chose a competitor's product over yours, and a “no decision” means they don’t buy from anyone.
It's important to decide ahead of time whether to include no decisions in your losses and stick consistently to that. Otherwise, this metric loses meaning.
First, let's look at an essential metric within your win/loss ratio: the win rate. You can measure your win rate with this simple formula:
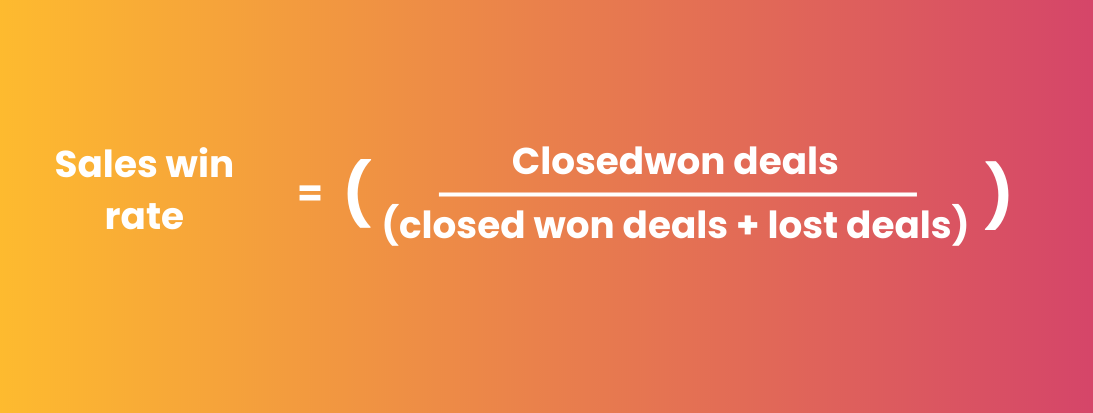
Now, the formula for your win/loss is also simple: wins over losses. You can then note how often you've had a successful sale versus how often you've had losses.
Market share
Your market share refers to the percentage of the market or industry your company owns over a defined period.
Think of the market as a pie chart. If you, for example, were a company selling smartphones, you’d be measuring yourself against everyone else selling smartphones.
The percentage of people choosing your smartphones over everyone else’s is your market share.
To calculate your market share, you can use the following formula:
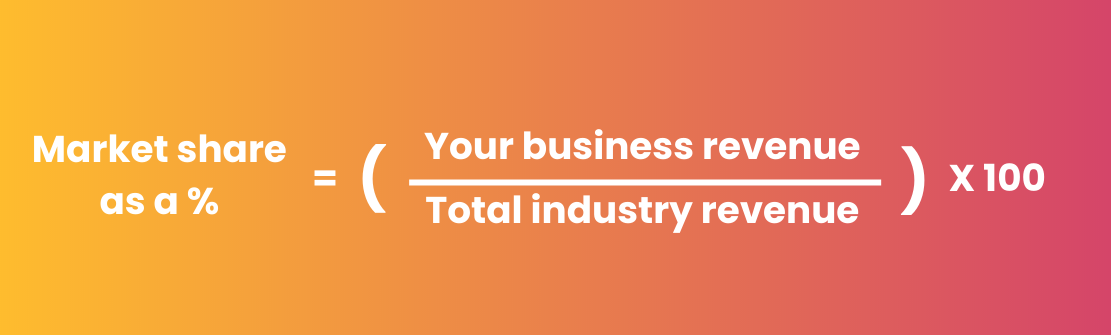
When you launch a product, tracking how well you’re doing compared to your direct competitors is important. And yeah, you guessed it - this metric allows you to do just that.
Sign-ups
Sign-ups could be referring to a newsletter, a private group on LinkedIn, or launch announcements. This metric is useful for multiple reasons.
First, when you’ve publicly announced your product but haven’t launched yet, sign-ups are a great way to gauge its popularity. But for this metric to be the most effective, you do need to set targets ahead of time.
By establishing how much interest there is, you can set more accurate targets for the first days, weeks, and months after your launch. Sign-ups to the free channels on your business allow you to understand how well your messagingWith this metric, you’re tracking the number of people using your digital channels, website traffic, social media users, etc. is resonating and if your product is finding the right audience.
Once you have that captive audience, you can start converting those leads into paying customers.
Conversion rates
Your conversion rate is the percentage of free users who convert to paying customers. With this metric, you’re tracking the number of people using your digital channels, website traffic, social media users, etc., who then become buyers.
Conversion rate is really important because, while getting people onto your website and interacting with your marketing is an important step, you can’t run a business on likes and shares alone.
ARR and MRR
ARR and MRR are Annual Referring Revenue and Monthly Recurring Revenue, respectively. They refer to the amount of revenue you can expect to make over a defined period of time.
These metrics are both incredibly valuable because they allow you to:
- Quantify the growth of your business.
- Understand how successful your launch strategy is.
- Demonstrate your value to stakeholders.
When measuring for these metrics you include recurring invoices, upgrade revenue and downgrade revenue, meaning when a customer moves to a cheaper subscription option. These metrics are typically used by SaaS companies working with a subscription model.
To sum up
With these metrics, you can measure your product launch's success and ensure it’s on track to deliver the results you need.
And remember, for these metrics to be their most effective, follow these top tips:
- Set your goals ahead of time.
- Decide a cadence for measuring ahead of time and stick to it.
- Choose metrics to track which make sense for your product and business model.